1. Information for 2023.
arrow_forward
Back to the Benchmark Report.
Abundant minerals for a net zero transformation
Australia is a secure and reliable source of minerals. With abundant reserves and an advanced mining industry, we will remain a top exporter of minerals. Australia boasts the largest reserves of iron ore including magnetite and high-grade hematite, which are ideal for green steel production. We are also the world’s largest producer of lithium. This is in high global demand owing to the popularity of lithium batteries.
Australia boasts the world's largest reserves of zinc and nickel. We are also becoming a key supplier of multiple rare earth minerals. Australia is a promising destination for fresh investment. About 80% of our land is still largely unexplored, offering vast potential for discovering new mineral deposits.

Geoscience Australia, 2024, Australia’s Identified Mineral Resources; US Department of the Interior, 2024, Mineral Commodity Summaries; Austrade.
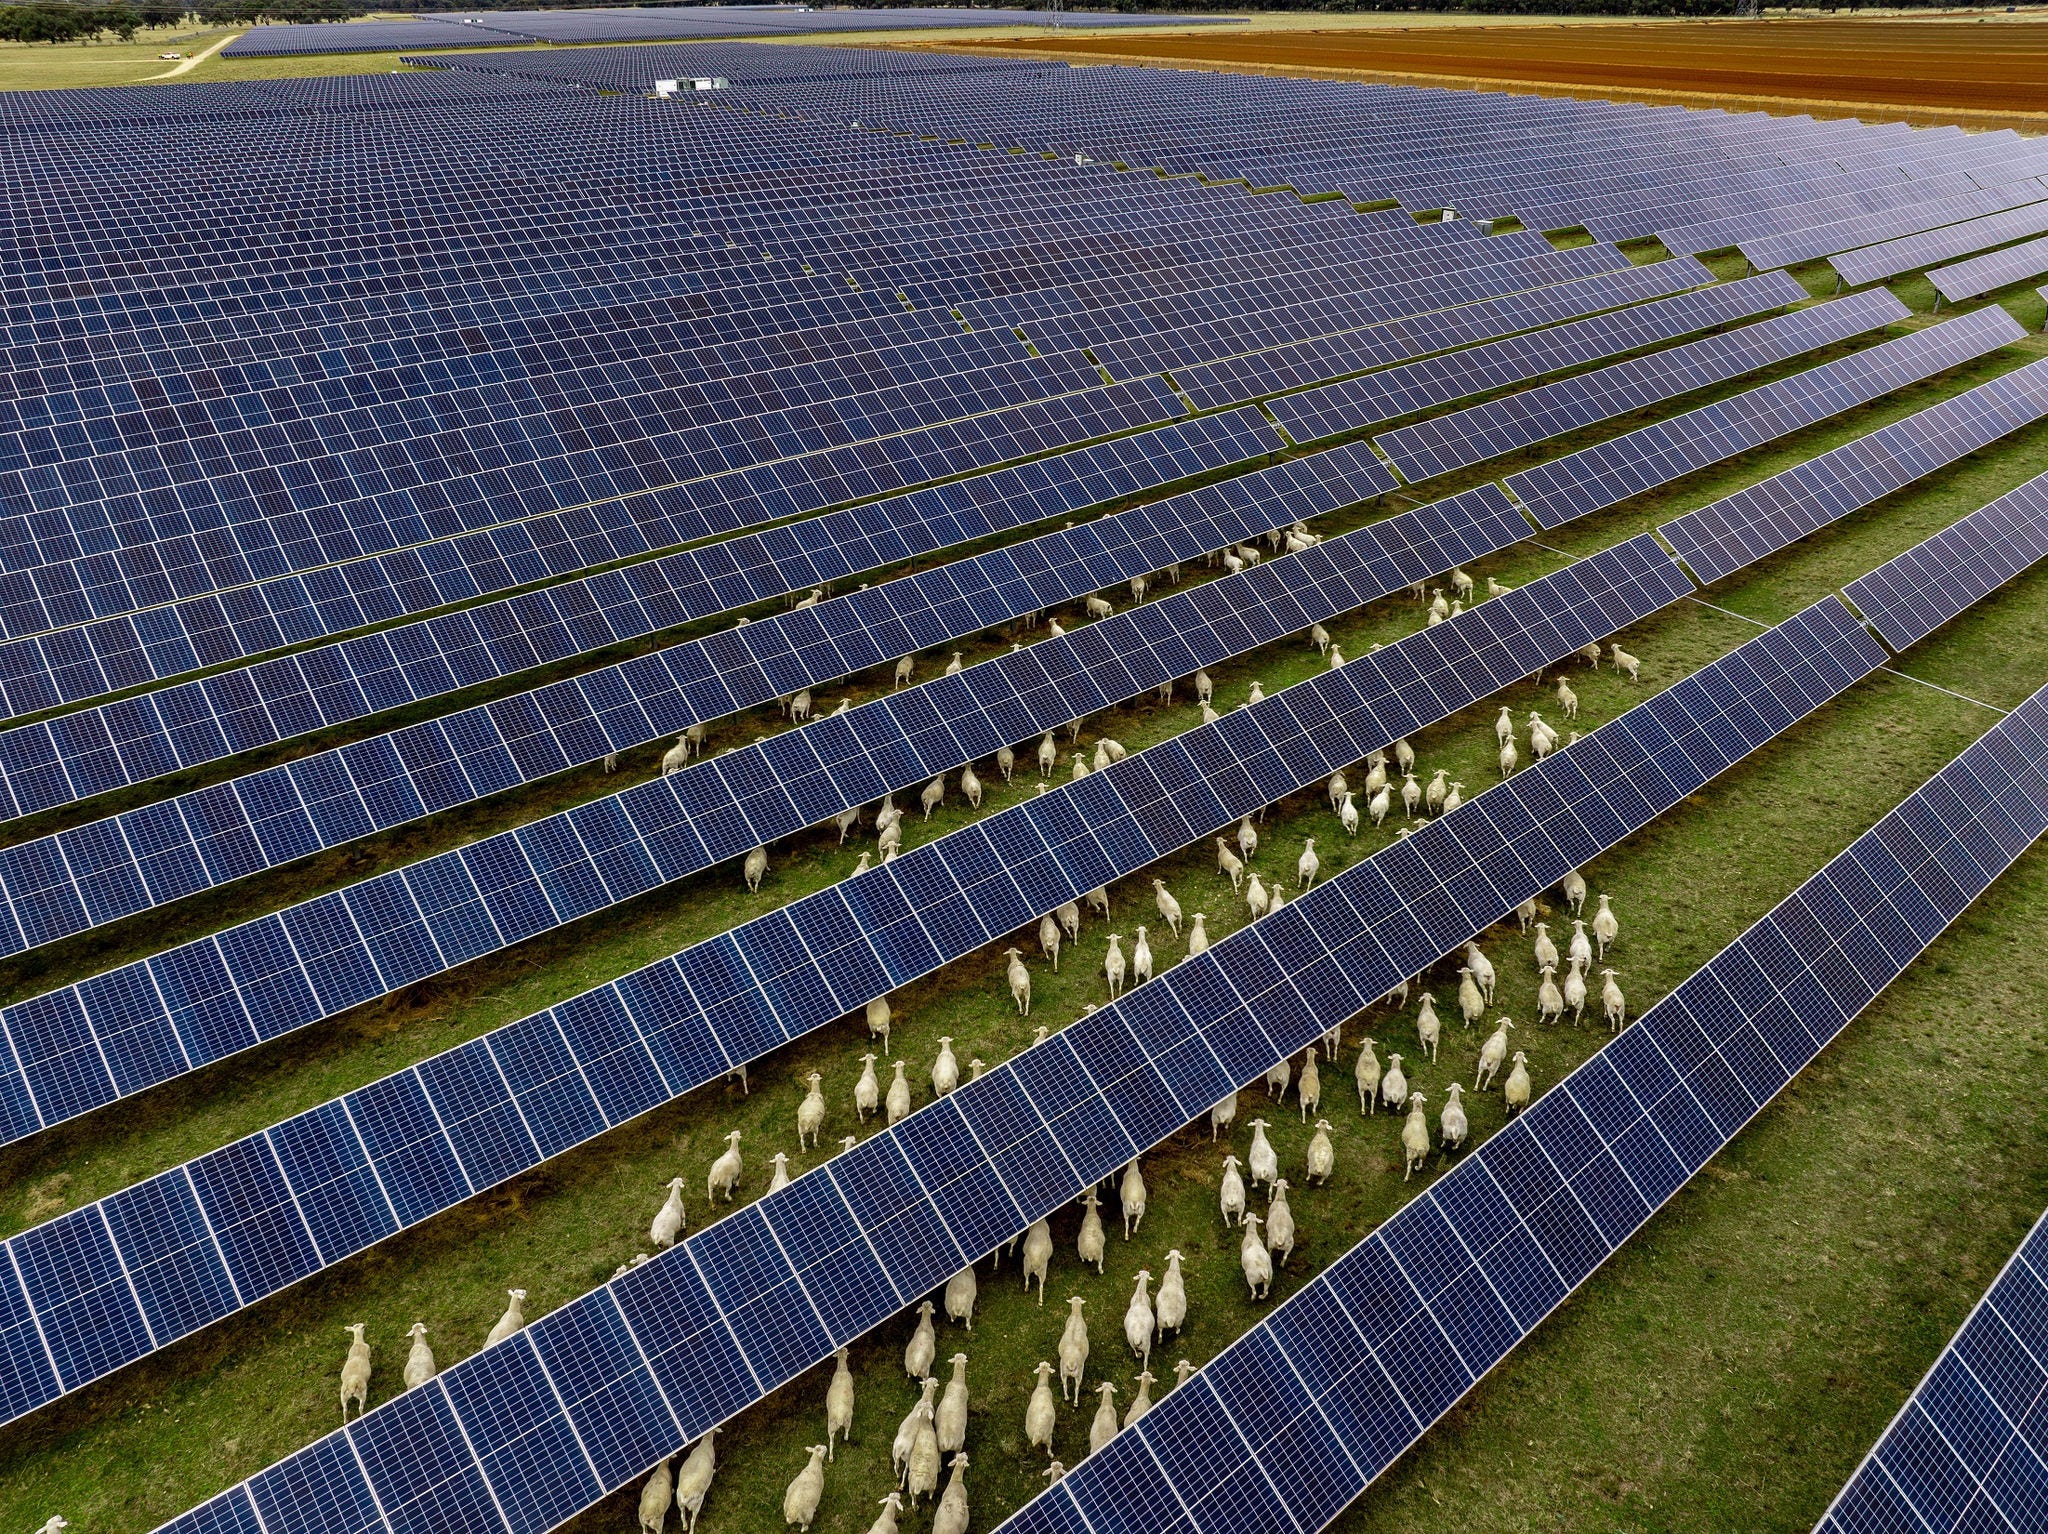
A top destination for renewables investment
Australia is a top-tier location for investment in renewable energy. We were the fifth most attractive destination in the world for renewable energy investment in 2023. This measure considers factors such as energy demand, policy reliability, project stability and delivery, and the diversity of natural resources.

EY, 2024, Renewable Energy Country Attractiveness Index 2023, accessed February 2024, Austrade
More about net zero transformation
Chapter 2 in the Benchmark Report provides further data and insights into Australia's net zero transformation.
Why Australia Benchmark Report
Discover why Australia is a great investment destination.
Go green with Australia
Resources, expertise and innovations to help create new industries and cleaner energy for a sustainable and net zero future.