Global ties and open markets

The gateway to wealthy Asia-Pacific markets and a solid opportunity base for global supply chain enrichment.

Proximity to Asia’s powerhouse economies

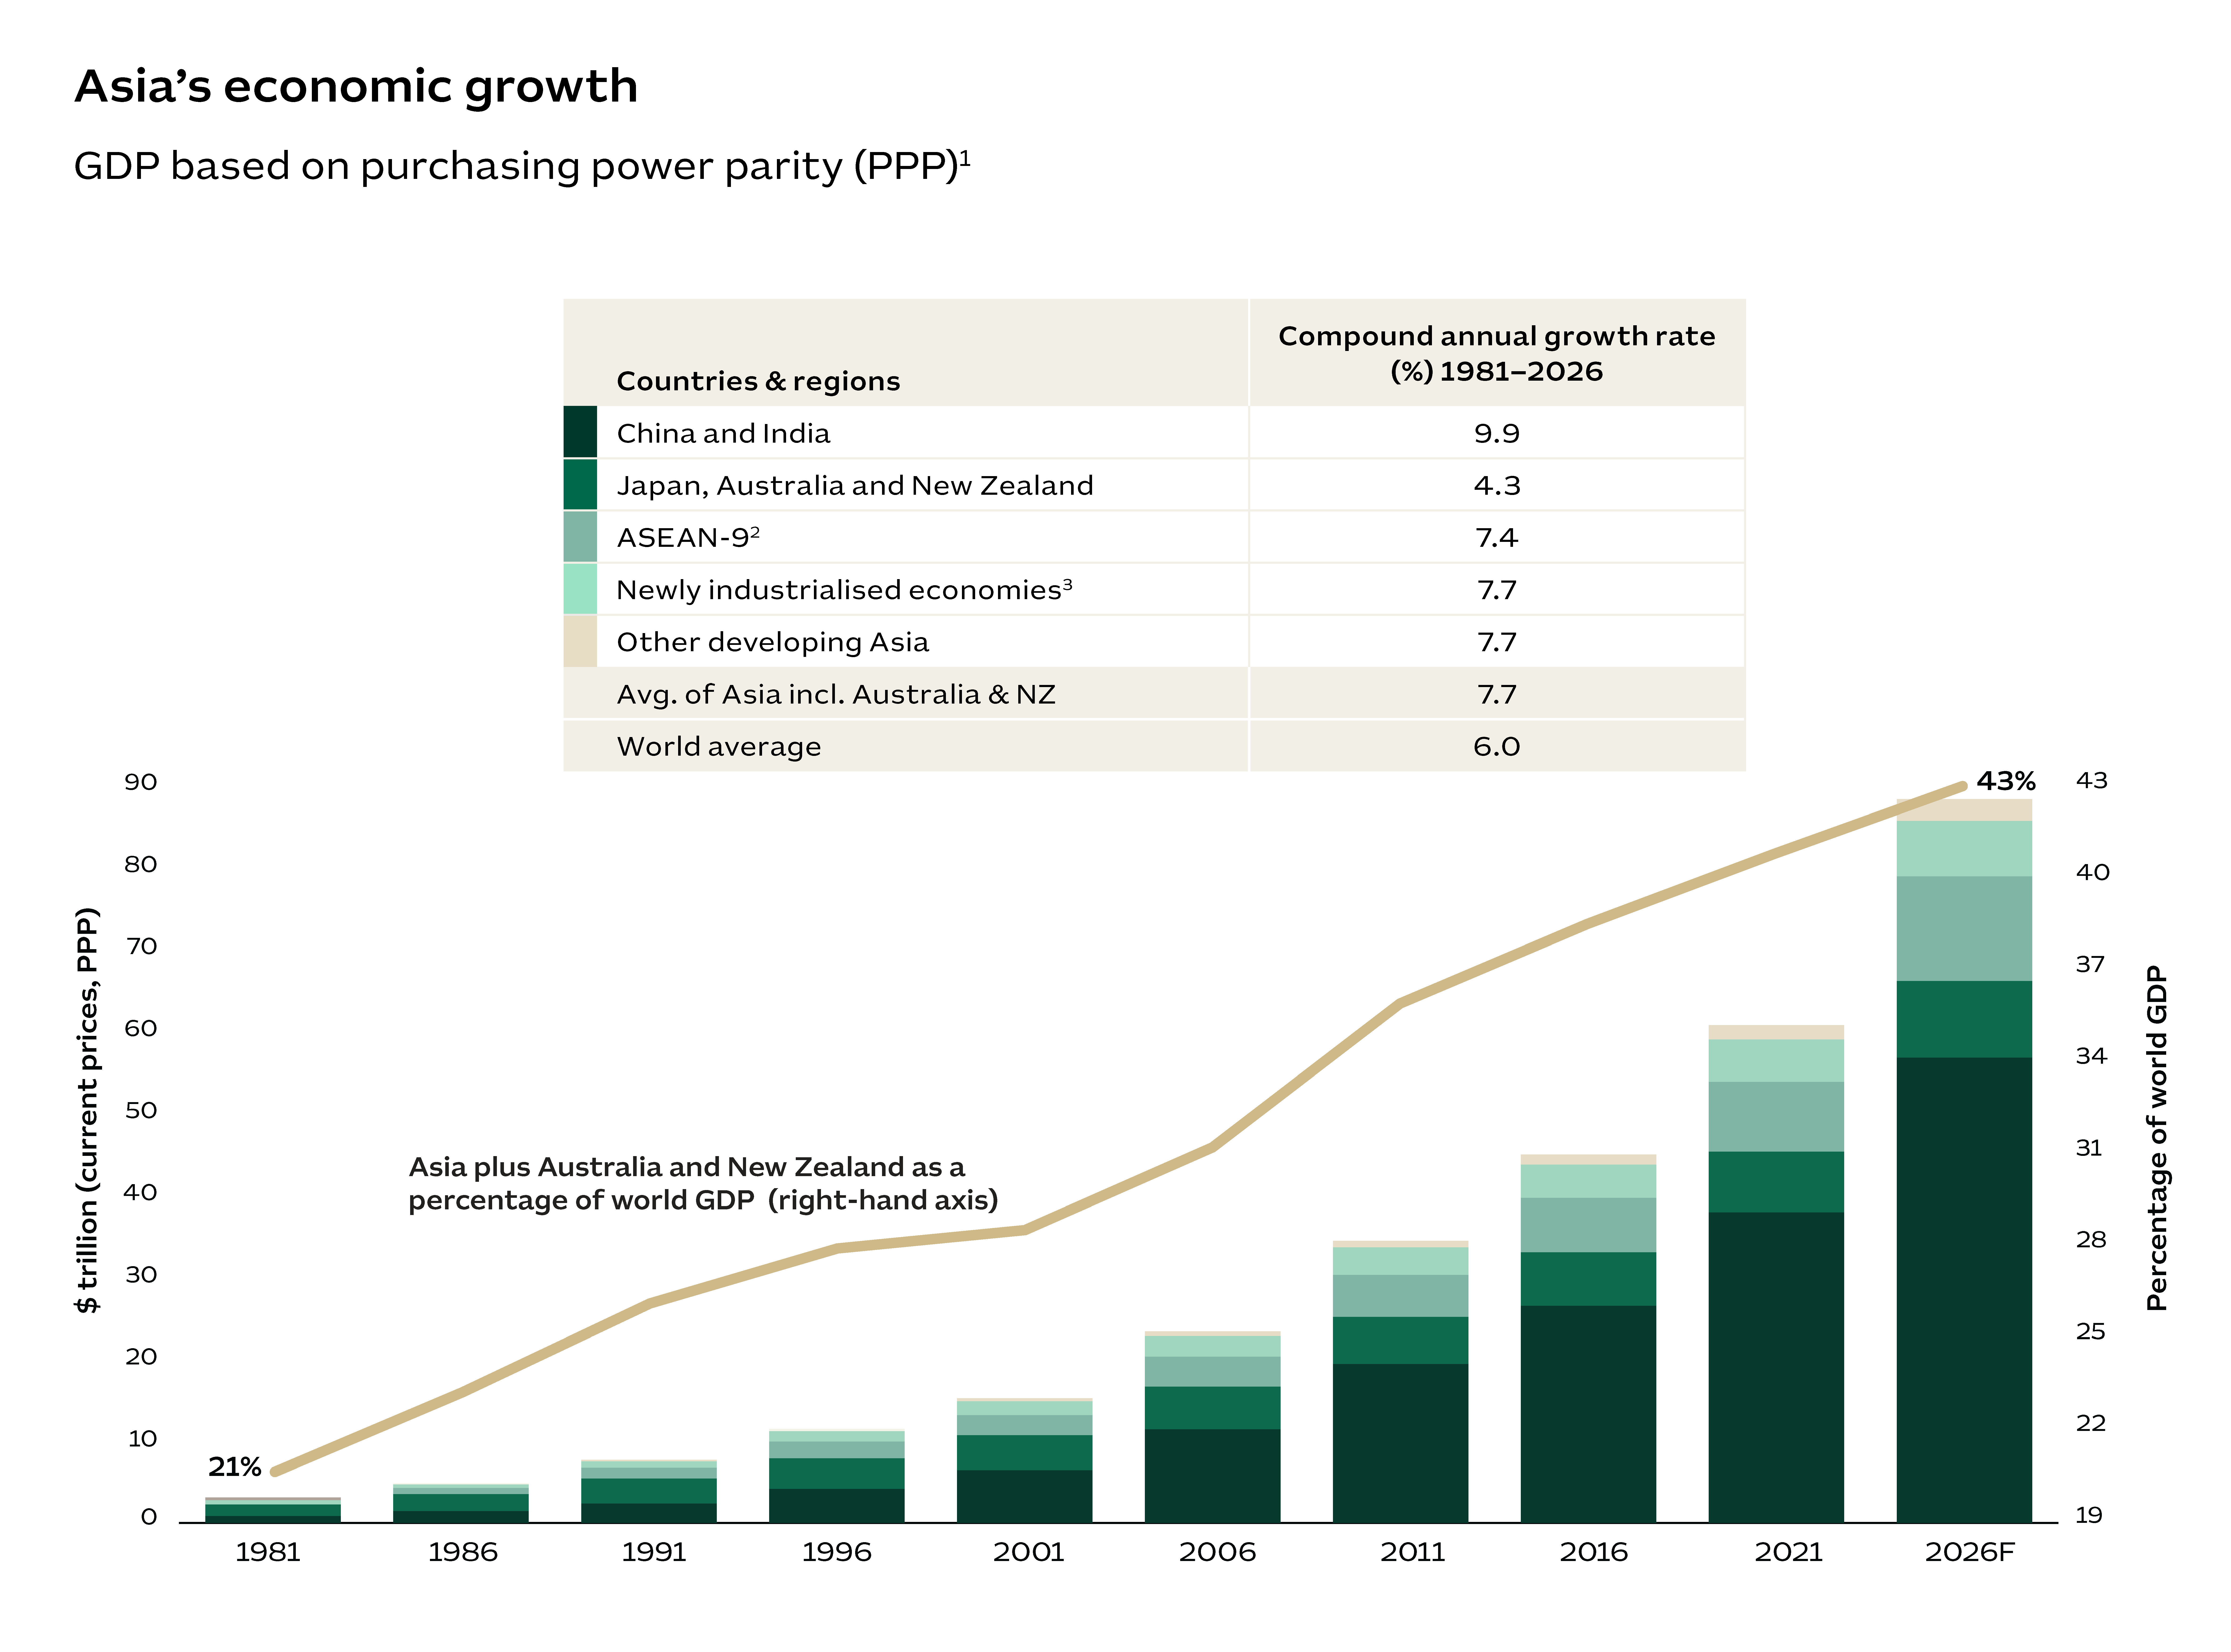
Australia benefits from Asia’s prosperity. In 1981, Asia accounted for just 21% of global GDP with this share expected to reach 45% by 2026. Most of Australia’s principal export partners are located in Northeast and Southeast Asia. A network of 18 free trade agreements gives Australian companies preferential access to these fast-growing markets. Asia’s middle class is growing strongly with an anticipated 3 billion consumers by 2030. This will trigger increased demand for Australia’s top exports:

  • resources and energy 
  • agriculture 
  • education
  • tourism 
  • healthcare services.⁴
The figure has a graph and a table. The table shows the country or region and its GDP compound annual growth rate in percentage terms from 1981 to 2026. The information is as follows: China and India 9.9%; Japan, Australia and New Zealand 4.3%; ASEAN 7.4%; Newly Industrialised Economies 7.7%; Other developing Asia 7.7%; Avg. of Asia incl. Australia & NZ 7.7%; and World average 6.0%.  The right-hand side axis plots the Asia plus Australia and New Zealand as a percentage of world’s GDP (right-hand axis) by year. The information is: 21% in 1981; 23% in 1986; 26% in 1991; 28% in 1996; 29% in 2001; 31% in 2006; 36% in 2011; 38% in 2016; 41% in 2021; and 43% in 2026 (forecast). In the left-hand side axis plots, the GDP based on purchasing power parity (PPP) by region in a stacked bar and year in the horizontal axis. The information for the left-hand side axis is:  China and India $0.82 in 1981 trillion; $1.44 in 1986 trillion; $2.34 in 1991 trillion; $4.15 in 1996 trillion; $6.42 in 2001 trillion; $11.38 in 2006 trillion; $19.35 in 2011 trillion; $26.44 in 2016 trillion; $37.81 in 2021 trillion; $56.67 in 2026F trillion;   Japan, Australia and New Zealand $1.43 in 1981 trillion; $2.06 in 1986 trillion; $3.06 in 1991 trillion; $3.70 in 1996 trillion; $4.24 in 2001 trillion; $5.22 in 2006 trillion; $5.74 in 2011 trillion; $6.52 in 2016 trillion; $7.41 in 2021 trillion; $9.34 in 2026F trillion;   ASEAN-9² $0.50 in 1981 trillion; $0.75 in 1986 trillion; $1.29 in 1991 trillion; $2.05 in 1996 trillion; $2.44 in 2001 trillion; $3.65 in 2006 trillion; $5.11 in 2011 trillion; $6.61 in 2016 trillion; $8.51 in 2021 trillion; $12.74 in 2026F trillion;   Newly Industrialised Economies³ $0.24 in 1981 trillion; $0.43 in 1986 trillion; $0.79 in 1991 trillion; $1.26 in 1996 trillion; $1.70 in 2001 trillion; $2.51 in 2006 trillion; $3.35 in 2011 trillion; $4.06 in 2016 trillion; $5.14 in 2021 trillion; $6.76 in 2026F trillion;   Other developing Asia $0.10 in 1981 trillion; $0.14 in 1986 trillion; $0.20 in 1991 trillion; $0.29 in 1996 trillion; $0.39 in 2001 trillion; $0.57 in 2006 trillion; $0.83 in 2011 trillion; $1.23 in 2016 trillion; $1.75 in 2021 trillion; and $2.66 in 2026F trillion.

1. The bar represents the value of regional gross domestic product at current prices based on purchasing power parity. 2. The Association of Southeast Asian Nations (ASEAN) includes Brunei Darussalam, Cambodia, Indonesia, Lao PDR, Malaysia, Myanmar, Philippines, Thailand and Vietnam. To avoid double counting with newly industrialised economies (NIEs) and ASEAN, Singapore was excluded from the ASEAN group. 3. NIEs: Singapore, Hong Kong SAR, Korea and Taiwan. 4. Brookings Institution, see source below.

F = Forecast
International Monetary Fund, 2024, World Economic Outlook April 2024; Brookings Institution, 2017, The unprecedented expansion of the global middle class; Austrade.

Foreign investment reaches A$4.7 trillion

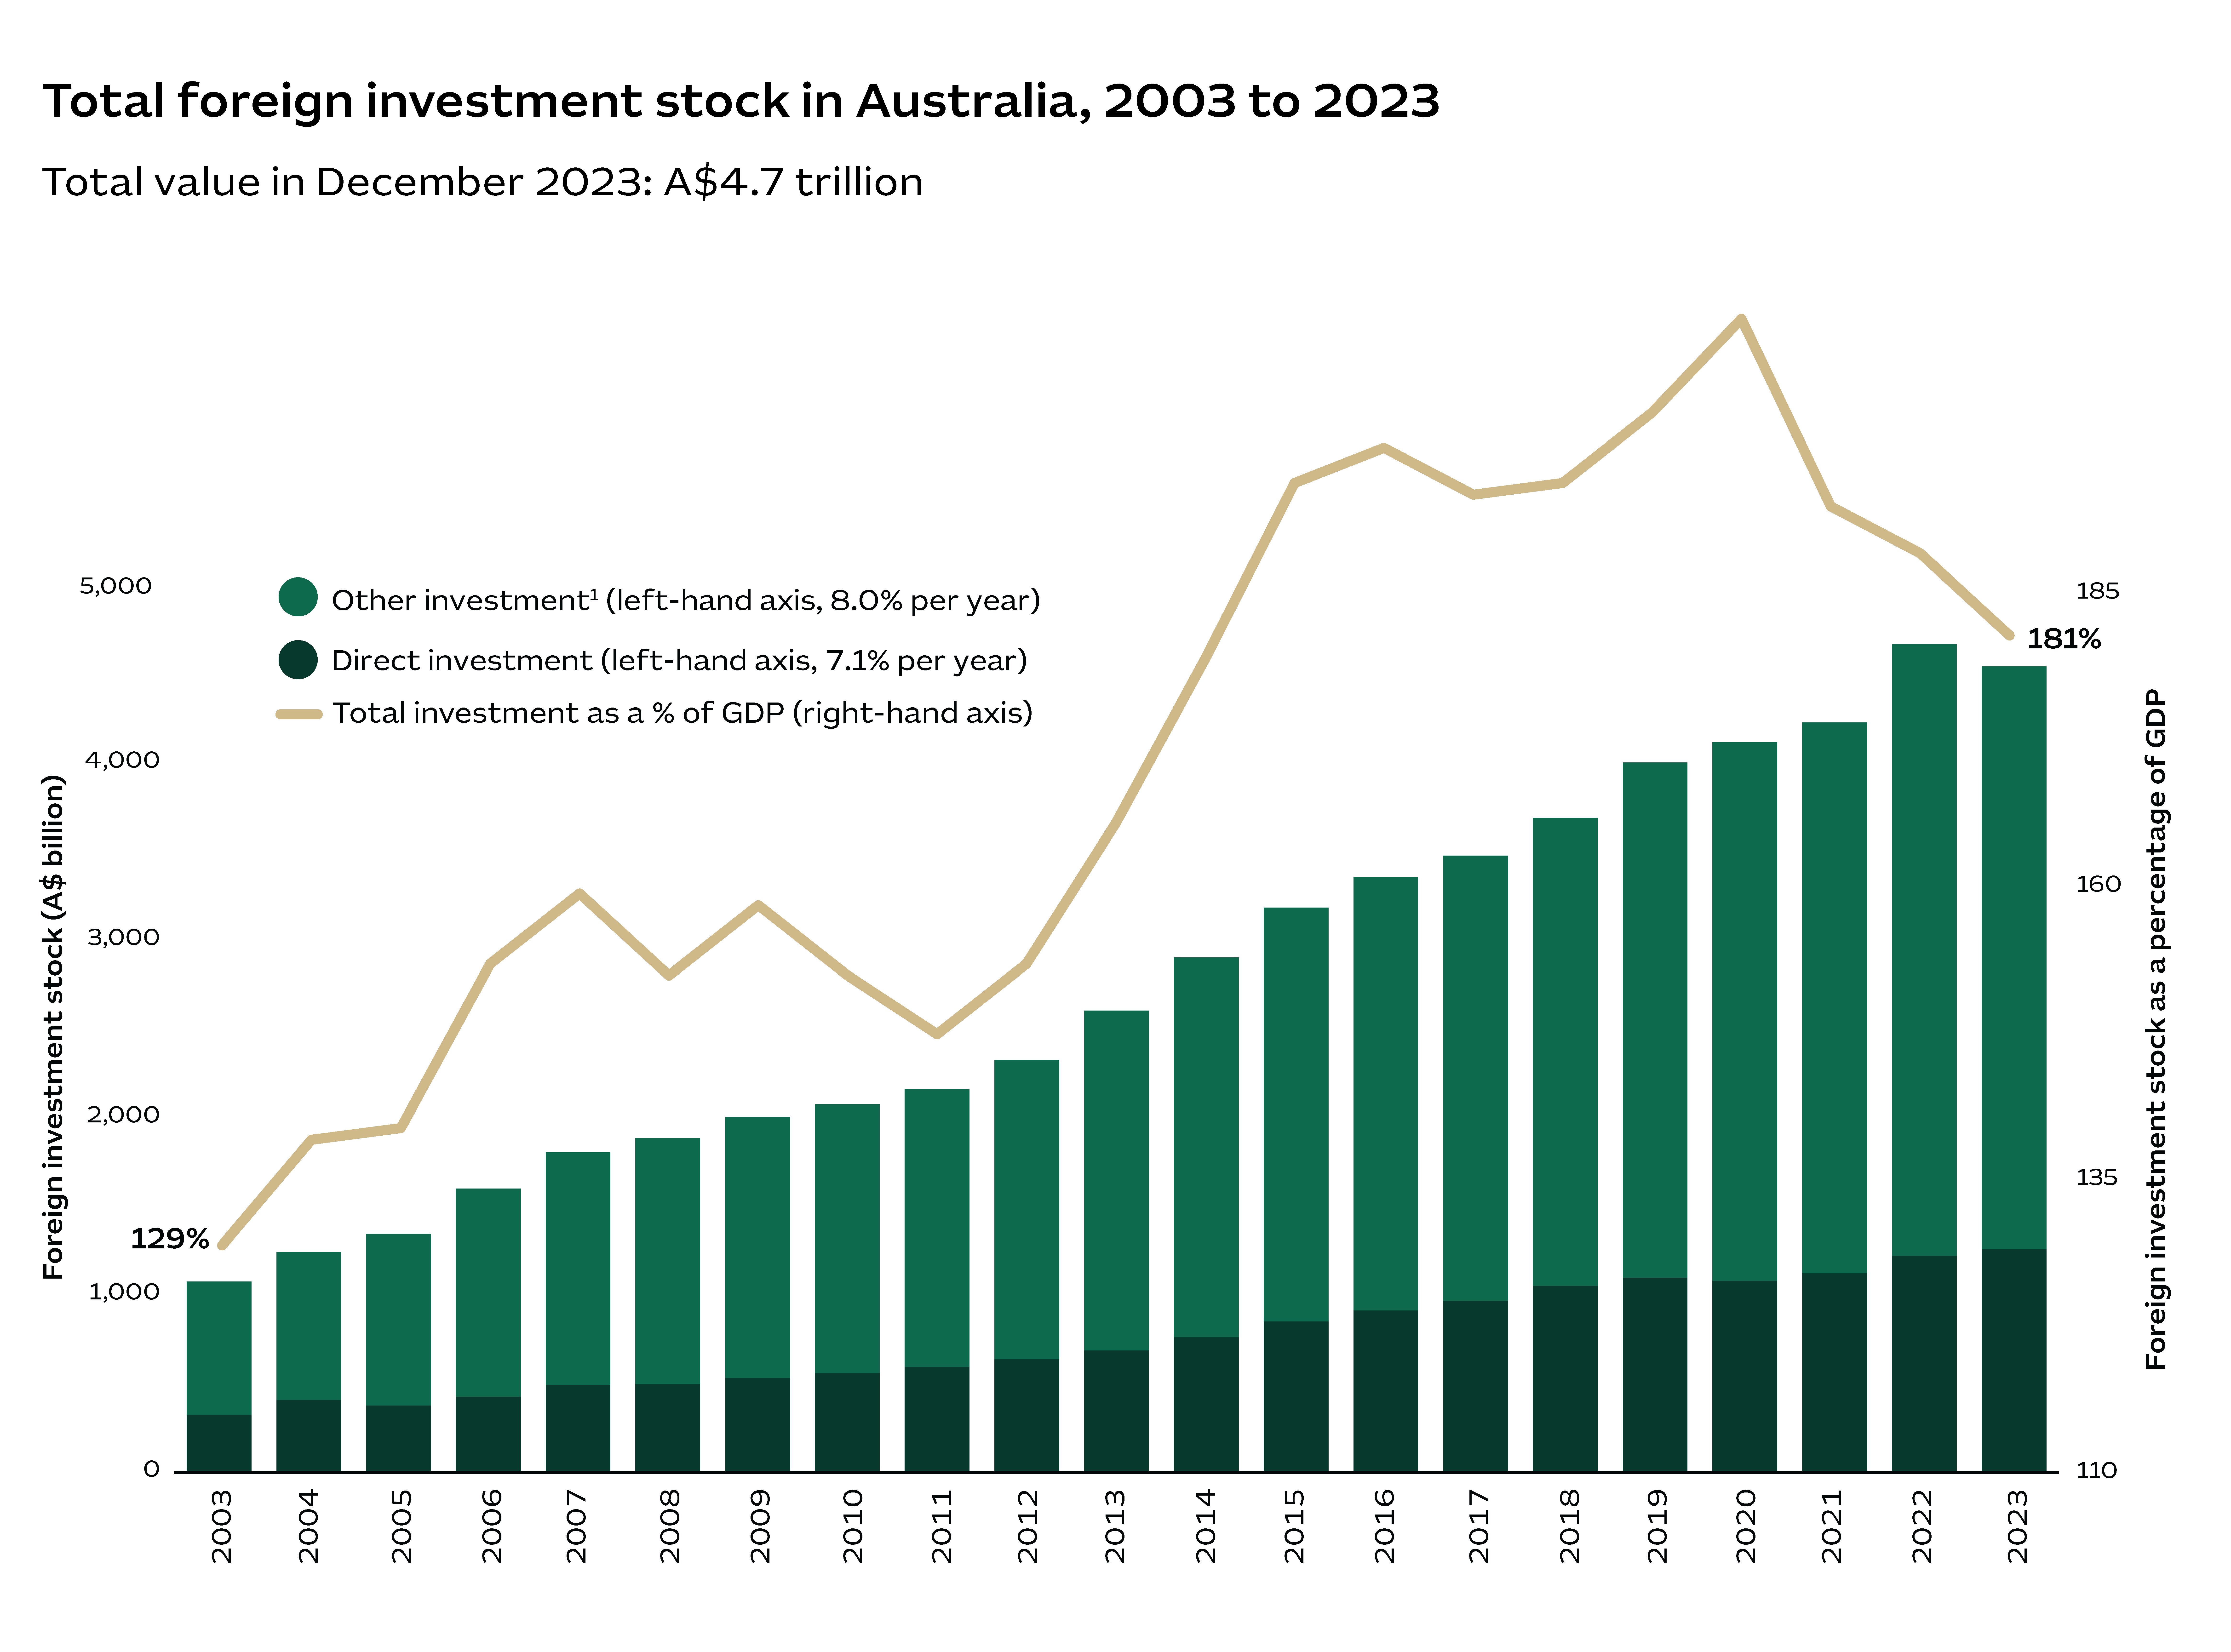
Australia is a standout destination for global investors. Since 2003, the stock of Foreign Direct Investment (FDI) in Australia has risen by an average of 7.1% each year. Other forms of foreign investment – including portfolio investments – have grown by 8% per year. This strong growth has resulted in the value of foreign investment in Australia reaching A$4.7 trillion. Confidence in our economy means Australia has bucked global trends. When FDI in Australia surged by 9% in 2022, the total stock of global FDI dipped by 6%. Over the past 2 decades, foreign investment has had a growing role in Australia’s economy. As a percentage of GDP, the stock of foreign investment has grown from 129% in 2003 to 181% in 2023.

The graph plots the foreign investment stock in Australia by type (direct and other) from 2003 to 2023, expressed in billions of Australian dollars. The information is as follows: In 2003, A$317 billion for direct investment, A$753 billion of other, given a total of $1069 billion. The total represents 129% of GDP. In 2004, A$401 billion for direct investment, A$835 billion of other, given a total of $1236 billion. The total represents 138% of GDP. In 2005, A$370 billion for direct investment, A$968 billion of other, given a total of $1338 billion. The total represents 139% of GDP. In 2006, A$420 billion for direct investment, A$1174 billion of other, given a total of $1594 billion. The total represents 153% of GDP. In 2007, A$486 billion for direct investment, A$1314 billion of other, given a total of $1800 billion. The total represents 159% of GDP. In 2008, A$490 billion for direct investment, A$1388 billion of other, given a total of $1878 billion. The total represents 152% of GDP. In 2009, A$525 billion for direct investment, A$1472 billion of other, given a total of $1998 billion. The total represents 158% of GDP. In 2010, A$552 billion for direct investment, A$1517 billion of other, given a total of $2069 billion. The total represents 152% of GDP. In 2011, A$586 billion for direct investment, A$1568 billion of other, given a total of $2154 billion. The total represents 147% of GDP. In 2012, A$629 billion for direct investment, A$1690 billion of other, given a total of $2319 billion. The total represents 153% of GDP. In 2013, A$680 billion for direct investment, A$1918 billion of other, given a total of $2598 billion. The total represents 165% of GDP. In 2014, A$754 billion for direct investment, A$2143 billion of other, given a total of $2897 billion. The total represents 179% of GDP. In 2015, A$843 billion for direct investment, A$2335 billion of other, given a total of $3178 billion. The total represents 194% of GDP. In 2016, A$905 billion for direct investment, A$2445 billion of other, given a total of $3350 billion. The total represents 197% of GDP. In 2017, A$960 billion for direct investment, A$2512 billion of other, given a total of $3472 billion. The total represents 193% of GDP. In 2018, A$1046 billion for direct investment, A$2638 billion of other, given a total of $3684 billion. The total represents 194% of GDP. In 2019, A$1091 billion for direct investment, A$2907 billion of other, given a total of $3998 billion. The total represents 200% of GDP. In 2020, A$1074 billion for direct investment, A$3039 billion of other, given a total of $4113 billion. The total represents 208% of GDP. In 2021, A$1115 billion for direct investment, A$3108 billion of other, given a total of $4223 billion. The total represents 192% of GDP. In 2022, A$1215 billion for direct investment, A$3450 billion of other, given a total of $4665 billion. The total represents 188% of GDP. In 2023, A$1251 billion for direct investment, A$3479 billion of other, given a total of $4730 billion. The total represents 181% of GDP.

Other investment is the balance of total investment less direct investment. As such, it represents portfolio investment, financial derivatives and other investment categories from Australian Bureau of Statistics (ABS) source data.

ABS, 2024, Balance of payments, Table 15; ABS, 2024, Australian national accounts: national income, expenditure and product, Table 3; United Nations Conference on Trade and Development, 2024, Data Centre – Foreign direct investment: Inward and outward flows and stock, annual; Austrade.

More about global ties & open markets

Chapter 4 in the Benchmark Report provides further data and insights into global ties and open markets.