Economic and business fundamentals

The ideal economy to establish or expand your business with a supportive, business-friendly environment

Our outperforming economy

Australia consistently grows faster than other advanced economies. During 2019 to 2024, our economy is forecast to have grown by 11.1%. This will outpace the average of 7.8% growth for advanced economies. Over this period, we will have matched growth in the US, almost tripled the expansion in the Euro Area, and recorded growth that is 5 times the rate of the UK.

Australia is also forecast to continue to outperform our peers over the next 5 years to 2029. As a major regional exporter, our outlook partly reflects the prosperity of our major trading partners. This includes India, China and the Association of Southeast Asian Nations (ASEAN)² economies.
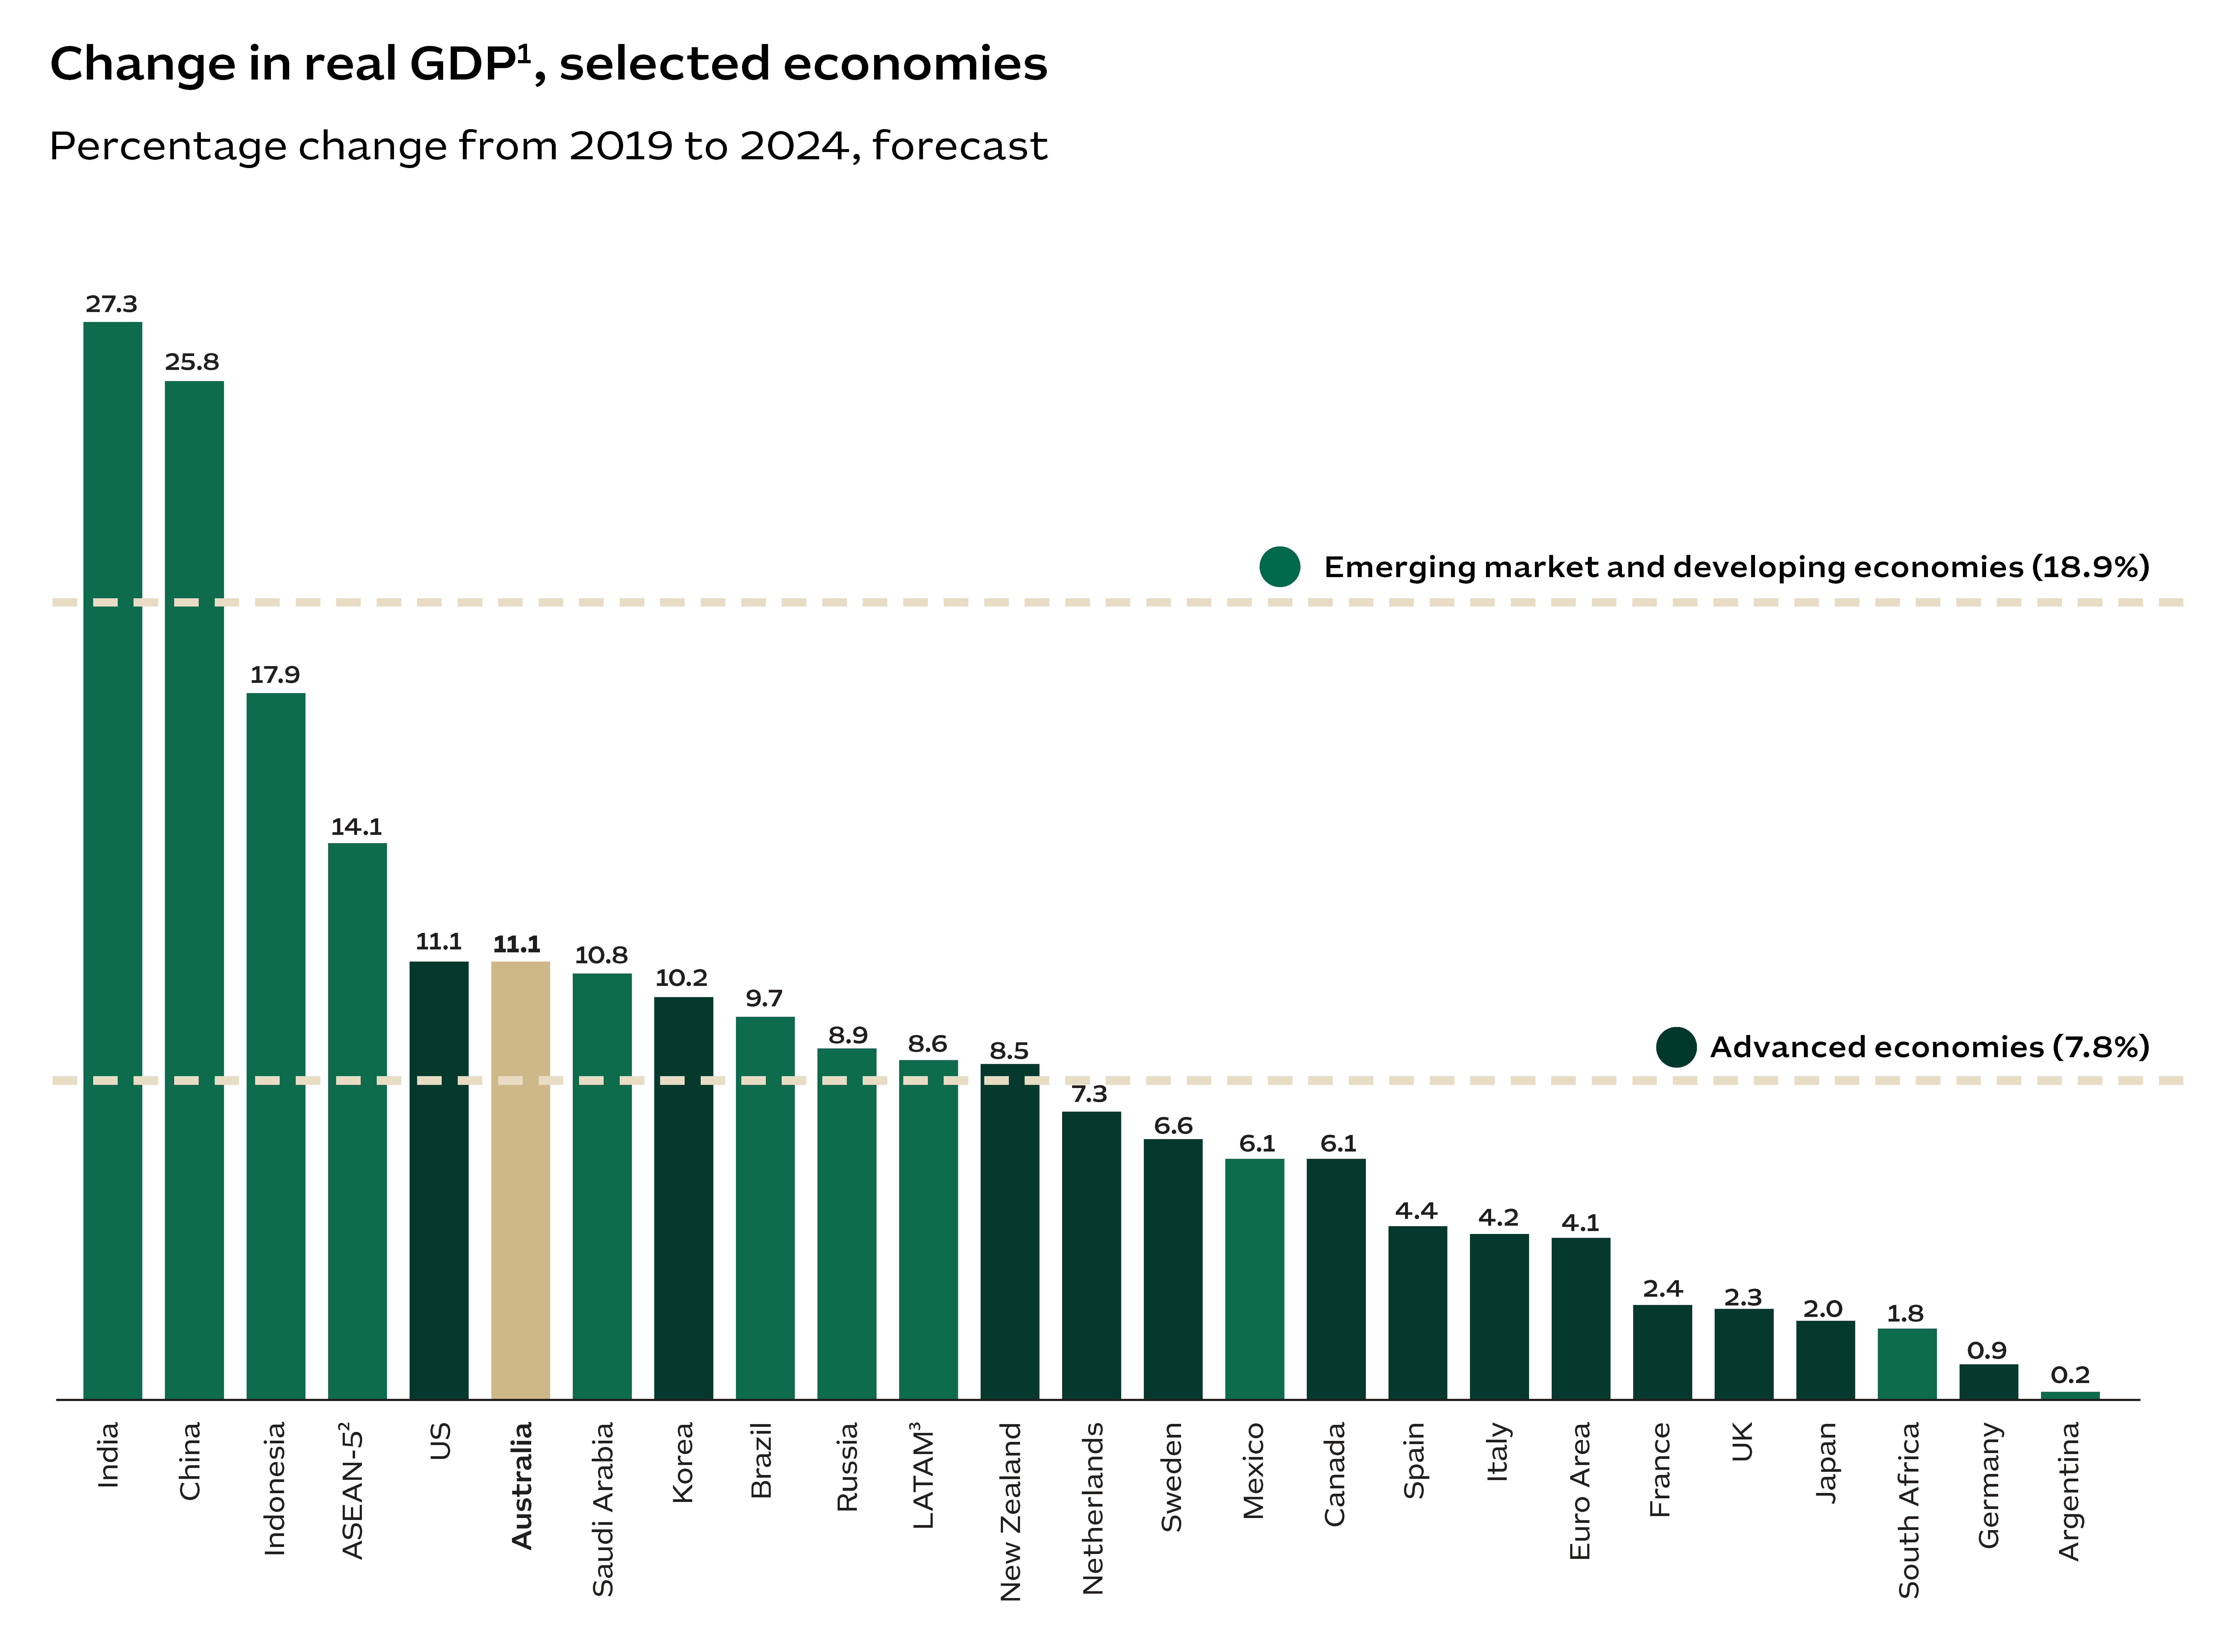
The graph shows the estimated percentage change in real gross domestic product (GDP) for selected economies from 2019 to 2024. The selected economies are: Emerging markets and developing economies (18.9%); advanced economies (7.8%); India 27.3%; China 25.8%; Indonesia 17.9%; Association of Southeast Asian Nations 14.1%; US 11.1%; Australia 11.1%; Saudi Arabia 10.8%; Korea 10.2%; Brazil 9.7%; Russia 8.9%; Latin America and the Caribbean 8.6%; New Zealand 8.5%; Netherlands 7.3%; Sweden 6.6%; Mexico 6.1%; Canada 6.1%; Spain 4.4%; Italy 4.2%; Euro Area 4.1%; France 2.4%; UK 2.3%; Japan 2.0%; South Africa 1.8%; Germany 0.9%; and Argentina 0.2%.

1. Gross domestic product (GDP) is in national currency and constant prices. 2. Association of Southeast Asian Nations. The forecast includes Indonesia, Malaysia, Philippines, Singapore and Thailand. Singapore is classified as an advanced economy. 3. Latin America and the Caribbean.

International Monetary Fund, 2024, World Economic Outlook, April 2024 database; Austrade.

Australia is a low-tax country

Australia has one of the lowest overall tax rates. Our tax revenue is equal to just 29% of GDP, which is 5 percentage points lower than the 34% average for OECD countries.¹ Australian taxes on goods and services are equivalent to 7% of Australia’s GDP, compared to 11% across OECD countries. Australia’s corporate tax rate is typically lower due to various deductions, credits and incentives.

Research and development (R&D) tax incentives significantly reduce rates for innovative companies. A small company that invests $100,000 in R&D may be eligible to receive a cash refund of over $40,000. Australia's corporate tax laws are stable and predictable. This helps to reduce costs, like tax agreements with other countries that prevent tax duplication.
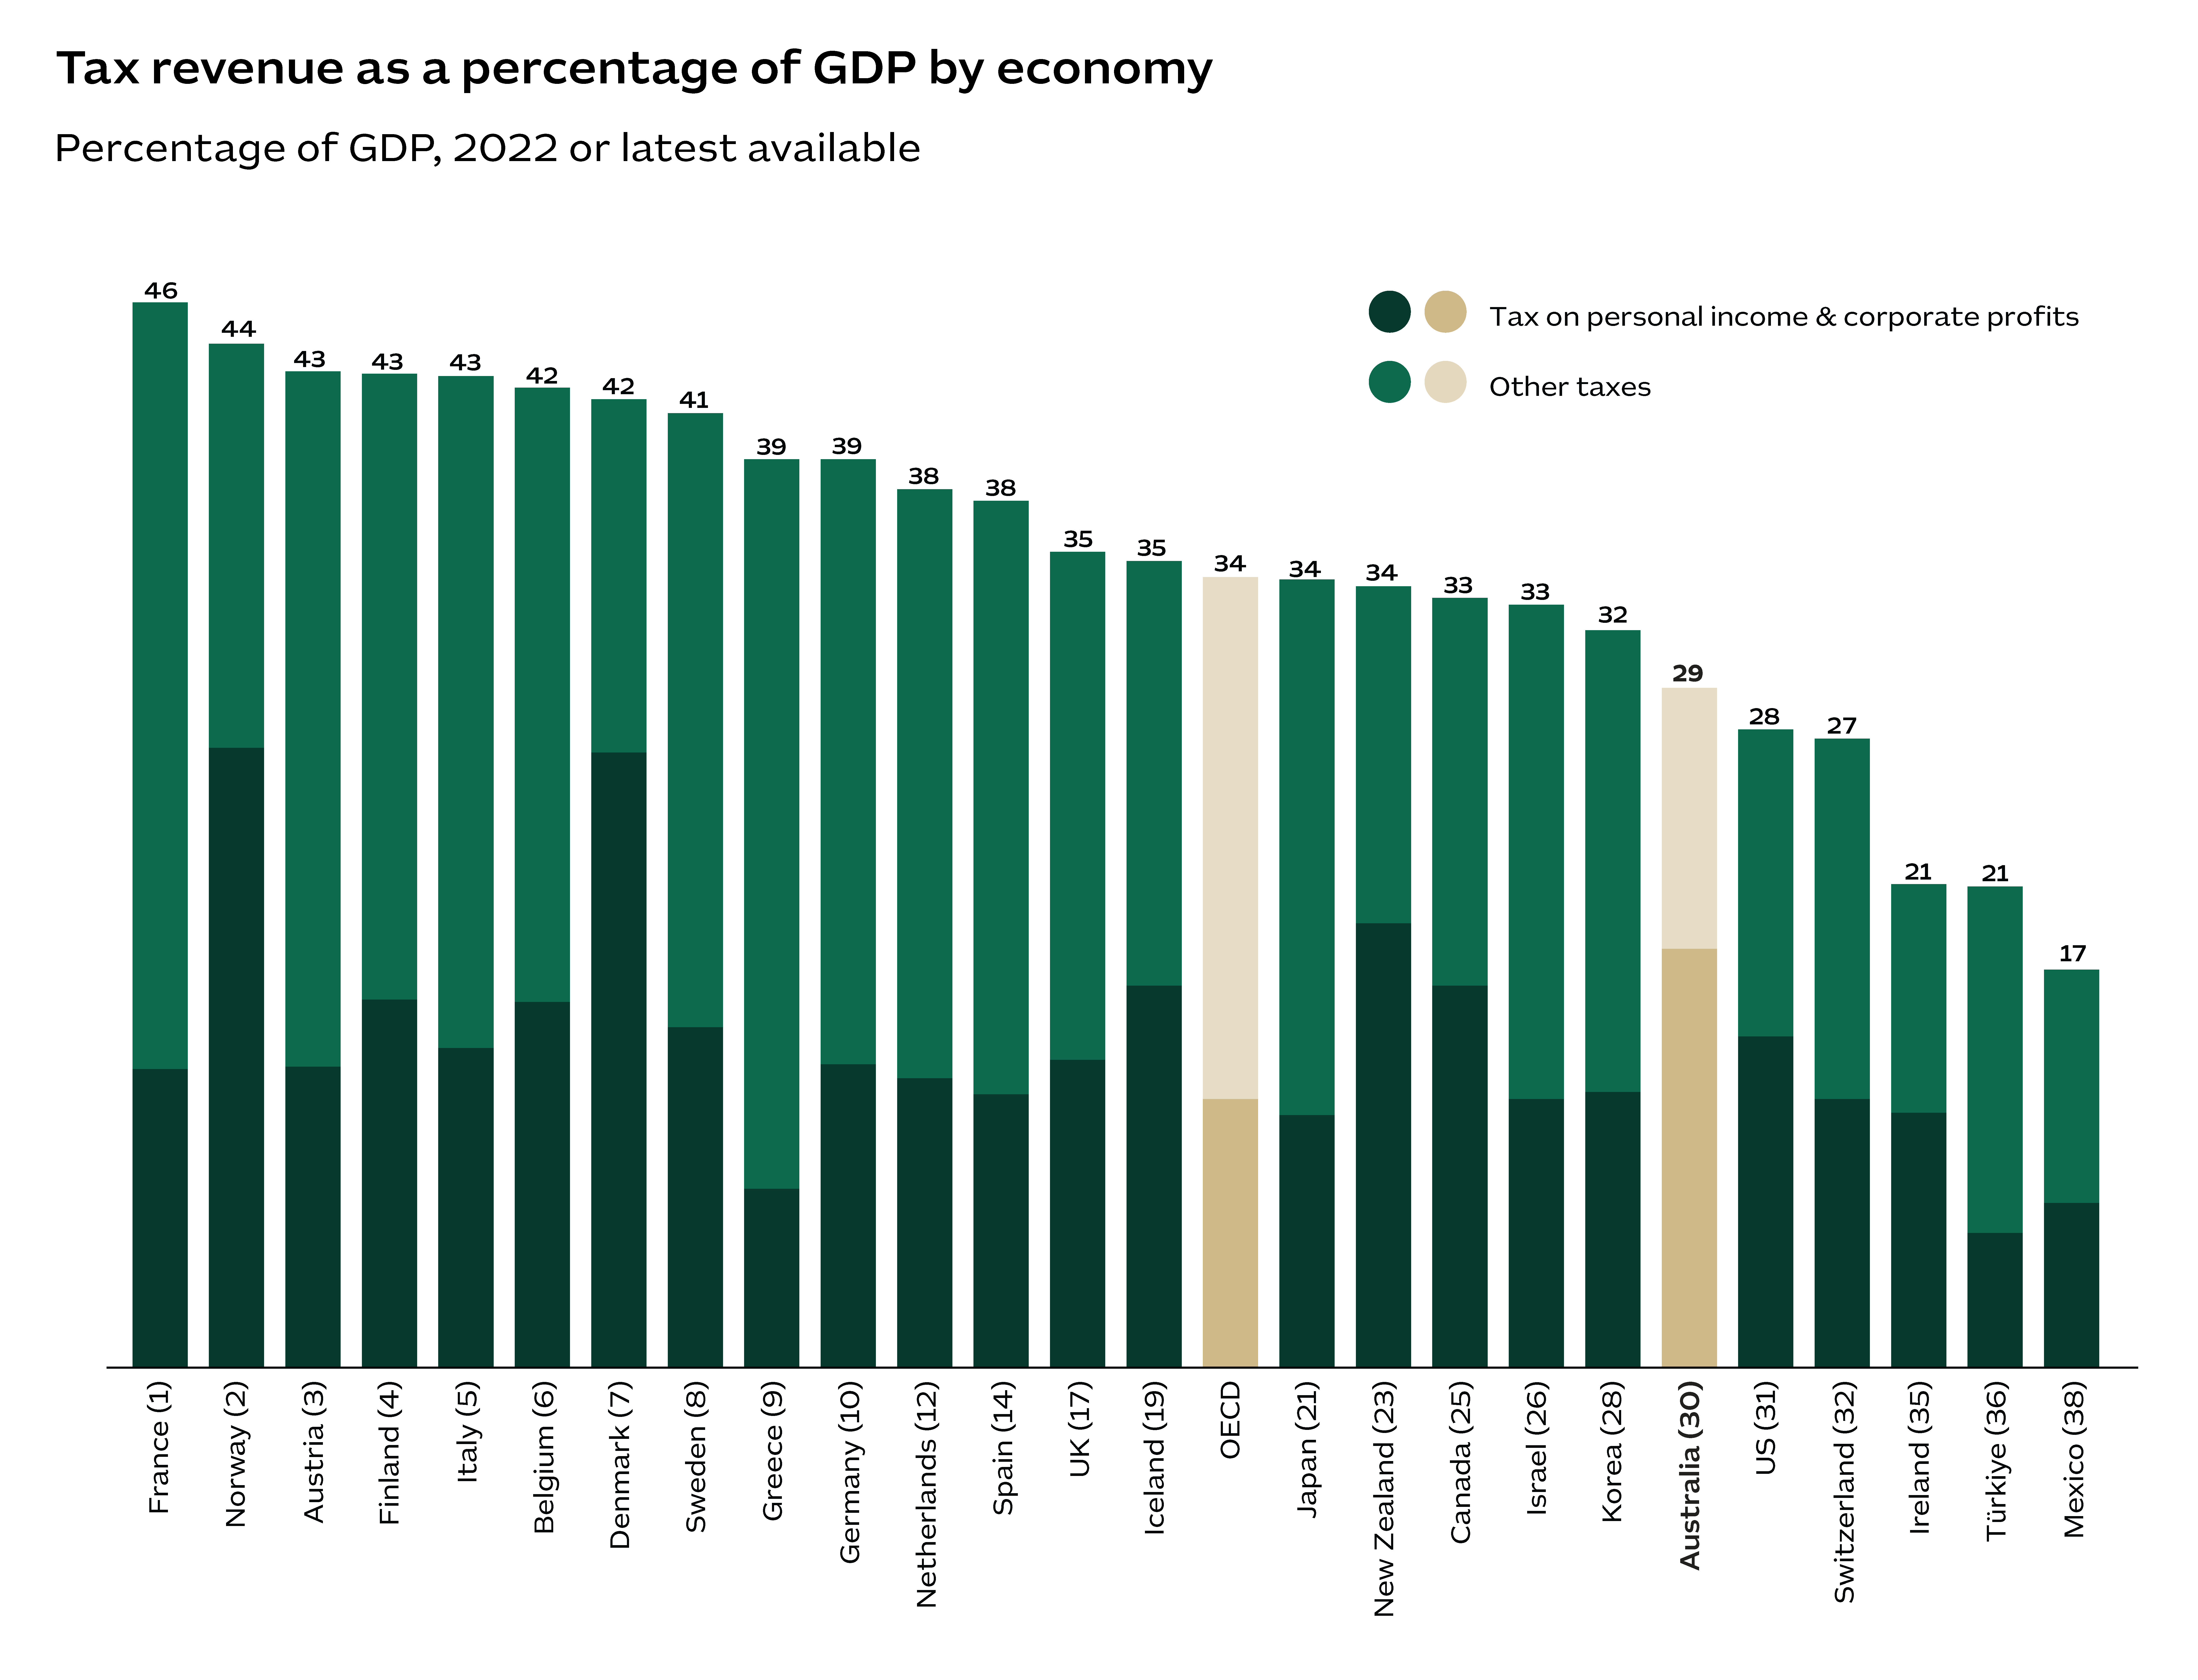
A bar chart shows the tax revenue as a percentage of gross domestic product (GDP) by country, using 2021 data or the latest available across the OECD dataset. The bar chart is stacked; the top part shows tax on personal income and corporate profits, and the lower part shows other taxes.  The figures behind the graph are: France (1) 13% for personal & corporate; 33% for other taxes; and 46 for total; Norway (2) 27% for personal & corporate; 18% for other taxes; and 44 for total; Austria (3) 13% for personal & corporate; 30% for other taxes; and 43 for total; Finland (4) 16% for personal & corporate; 27% for other taxes; and 43 for total; Italy (5) 14% for personal & corporate; 29% for other taxes; and 43 for total; Belgium (6) 16% for personal & corporate; 27% for other taxes; and 42 for total; Denmark (7) 27% for personal & corporate; 15% for other taxes; and 42 for total; Sweden (8) 15% for personal & corporate; 27% for other taxes; and 41 for total; Greece (9) 8% for personal & corporate; 32% for other taxes; and 39 for total; Germany (10) 13% for personal & corporate; 26% for other taxes; and 39 for total; Netherlands (12) 13% for personal & corporate; 25% for other taxes; and 38 for total; Spain (14) 12% for personal & corporate; 26% for other taxes; and 38 for total; UK (17) 13% for personal & corporate; 22% for other taxes; and 35 for total; Iceland (19) 16% for personal & corporate; 18% for other taxes; and 35 for total; OECD 12% for personal & corporate; 23% for other taxes; and 34 for total; Japan (21) 11% for personal & corporate; 23% for other taxes; and 34 for total; New Zealand (23) 19% for personal & corporate; 15% for other taxes; and 34 for total; Canada (25) 16% for personal & corporate; 17% for other taxes; and 33 for total; Israel (26) 12% for personal & corporate; 21% for other taxes; and 33 for total; Korea (28) 12% for personal & corporate; 20% for other taxes; and 32 for total; Australia (30) 18% for personal & corporate; 11% for other taxes; and 29 for total; US (31) 14% for personal & corporate; 13% for other taxes; and 28 for total; Switzerland (32) 12% for personal & corporate; 16% for other taxes; and 27 for total; Ireland (35) 11% for personal & corporate; 10% for other taxes; and 21 for total; Türkiye (36) 6% for personal & corporate; 15% for other taxes; and 21 for total; Mexico (38) 7% for personal & corporate; 10% for other taxes; and 17 for total.

1. Measured as a percentage of GDP. Tax systems across countries vary significantly and this makes direct comparisons difficult on a like-for-like basis. A simple measure used by the OECD is to consider the total ‘tax take’ of an economy. The tax take (or tax burden) is the ratio of total tax revenues to GDP, at market prices. This ratio is a broad measure of a country’s taxation impost which cuts across the various bases, rates and thresholds. 2. Social security contributions/taxes as “compulsory payments paid to general government that confer entitlement to receive a (contingent) future social benefit”. For example, unemployment insurance or family allowances. Social security contributions are often levied on employers and not only employees. 3. The number in brackets indicates the country’s ranking across OECD members.

Organisation for Economic Co-operation and Development, 2024, Revenue Statistics - OECD countries: Comparative tables, accessed on 28 Feb 2024; Austrade.

More about fundamentals

Chapter 1 in the Benchmark Report provides further data and insights into economic and business fundamentals.